Industry benchmarks reveal a clear investment logic; and most organizations are already acting on it. Here’s how to read the signals.
Every year, L&D teams face the same pressure: justify the spend. Boards want ROI. CFOs want benchmarks. And leaders at every level want to know whether their organization is investing in them — or just in the people above them.
The research tells a clarifying story. When you aggregate data across organizations of varying sizes, industries, and maturity levels, a coherent investment logic emerges…one that reflects both the strategic importance of leadership and the pragmatic realities of how development dollars flow.
Two patterns stand out above the rest: how budget scales with leadership level, and how delivery methods are evolving. Together, they offer a useful map for any organization designing or stress-testing its development strategy.
The Spend-to-Seniority Gradient is Real and Intentional
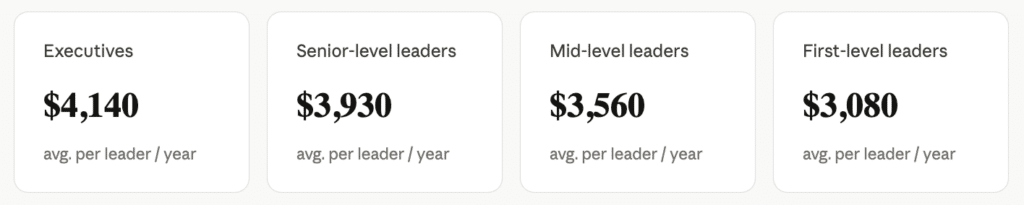
The median overall organizational budget for leadership development is approximately $350,000. But aggregate numbers like that can obscure what’s actually happening at the per-leader level, which is where strategy gets made.
What’s notable here isn’t the gradient itself but rather how steady it is. From first-level leaders to the C-suite, each step up the organizational ladder corresponds to a meaningful per-person increase. This isn’t a cliff between executives and everyone else; it’s a continuous slope.
The implication is significant. Organizations that are benchmarking well treat development investment as a function of scope and responsibility, not just title. A first-level manager overseeing a team of eight is being prepared for a role that carries real consequence, and the investment reflects that.
More than one in three organizations surveyed reported willingness to spend 25% more on high-potential employees, with nearly another third open to spending as much as 50% more — signaling that the gradient steepens further when talent identification enters the equation.
What’s also worth noting: budget allocation across levels is far more evenly distributed than most assume. When you look at the percentage of budget rather than per-leader spend, executives and senior leaders each receive roughly 20% of total allocation, while mid-level and first-level leaders receive around 21% each. This near-parity reflects an emerging philosophy: invest in leaders early and consistently, not just at the top.
Blended Delivery Isn’t a Trend; it’s Already the Baseline
Ask most learning leaders to describe their delivery strategy and they’ll say something like “blended.” What that means in practice, however, varies enormously. The benchmark data puts some useful specificity around the term.
Average % of Budget by Delivery Method
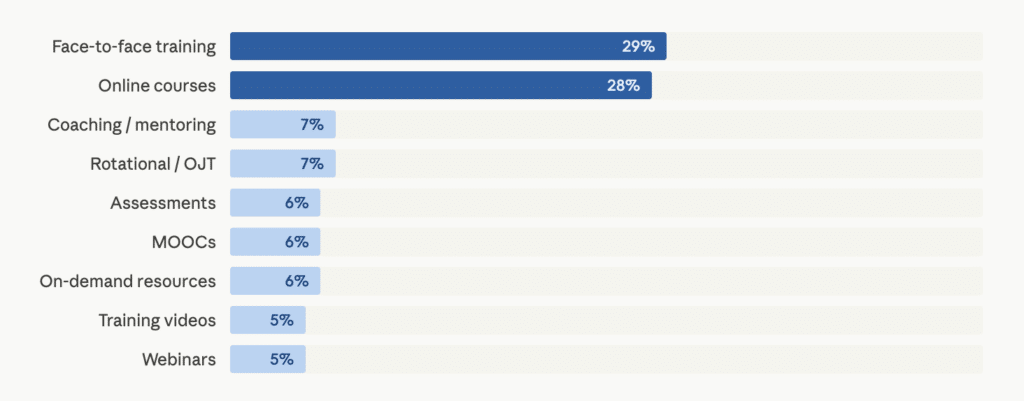
Face-to-face instruction and digital learning absorb nearly 60 cents of every development dollar combined. That’s a strong signal; organizations have not retreated from in-person experiences, even as digital options have multiplied. What they’ve done is add, not replace.
The remaining 40% of budget is spread across a range of modalities…coaching, rotational programs, assessments, MOOCs, and on-demand resources; each capturing between 5% and 7% of spend. No single method dominates the supplemental tier. That distribution is itself meaningful: it reflects intentional experimentation rather than cargo-cutting whatever worked before.
Assessments, in particular, deserve more attention than their 6% budget share might suggest. Unlike passive learning formats, assessments generate data about how a leader is perceived, where blind spots exist, and what’s changed over time. That diagnostic function compounds in value as organizations build longitudinal views of their leadership bench.
Who’s Actually Getting 360s, and Who Isn’t
One of the more instructive gaps in the benchmark data involves 360-degree feedback coverage. When organizations are asked which employee groups they’re targeting for leadership coaching, directors and vice presidents come out on top at 70%, followed closely by managers at 67%, and high-potential employees at 61%.
C-level executives are targeted by 51% of organizations, which means roughly half of organizations are not systematically investing in structured feedback at the top. Team leaders are included by 48%. Entry-level employees? Just 15%.
That coverage profile creates a predictable problem. Organizations identify high potentials early but don’t build the feedback infrastructure to support their development until they’ve already ascended. By the time the scaffolding appears, years of formation have already happened, with or without structured input.
First-level supervisors and individual contributors are most commonly allocated $3,000 or less per year for development; and structured assessment coverage for entry-level employees sits at just 15%. The compounding effect of early, low-investment development rarely shows up in a single budget cycle, but it shows up in bench strength.
The organizations getting this right are building assessment strategies that span the continuum…not because every leader needs the same intervention, but because insight gathered early becomes the foundation for smarter investment later.
What This Means for Strategy
Budget benchmarks are useful as calibration tools, but their deeper value is directional. They reveal the gap between what organizations say they value and where they actually allocate resources.
Three strategic reads emerge from this data:
- The per-leader gradient should be explicit, not emergent. Most organizations end up spending more on senior leaders by default: more complex programs, higher-cost facilitators, more travel. The organizations performing best in class make that gradient deliberate, tying investment levels to leadership scope rather than letting them drift upward organically.
- Blended delivery works best when the components reinforce each other. Face-to-face programming and digital learning shouldn’t live in separate catalogs. The strongest programs use digital modalities to prepare leaders for in-person experiences and to sustain learning after them, making the 57% combined spend on those two channels work in coordination, not in parallel.
- Assessment coverage is a leading indicator, not a lagging one. Organizations that deploy structured assessments broadly, across levels and across time, build a richer picture of their leadership population. That picture supports better deployment decisions, more targeted development investments, and more honest conversations about readiness.
The benchmark data doesn’t prescribe a single right answer. But it does make clear what organizations that consider themselves best-in-class are doing differently — and the gap between them and their peers is rarely about total spend.
It’s about how deliberately that spend is structured, distributed, and connected to the leaders it’s meant to develop. For organizational leaders, the takeaway isn’t simply how much to spend; but how deliberately leadership development dollars are deployed.
At Leadership Circle, we partner with organizations to translate benchmark data into action by anchoring development in deep assessment, continuous feedback, and leadership practices that scale across levels. When insight guides investment, development becomes less reactive and more strategic — strengthening today’s leaders while building the next generation with intention.